Introduction
Managing money can feel overwhelming when you do not have a clear plan. Many people earn well but still struggle to save or invest consistently. The key is not just how much you earn, but how you divide your income. A simple and effective way to do this is to create a pie chart that visually breaks down your finances into clear categories. This guide explains how to split your income wisely, with practical steps, real examples, and strategies aligned with smart financial habits.
What Does It Mean to Divide Your Income?
Dividing your income means assigning specific portions of your earnings to different financial goals. These usually include:
- Daily spending
- Savings
- Investments
- Debt repayment (if applicable)
This approach ensures that every dollar has a purpose. Instead of guessing where your money goes, you control it with intention.
Key Definition
Income Allocation: The process of distributing your earnings across essential expenses, savings, and investments to achieve financial stability and growth.
When you use a visual tool like a pie chart, it becomes easier to see whether you are overspending or under-saving.
Takeaway: Dividing your income gives structure to your finances and helps you stay consistent with your goals.
Why a Pie Chart Works for Financial Planning
A pie chart is more than just a visual tool. It simplifies complex financial decisions into easy-to-understand segments.
Here is why it works:
- It gives a clear snapshot of your financial priorities
- It helps you quickly identify imbalancesHow Do You Divide Your Income for Saving, Spending, and Investing? A Practical Guide Using a Pie Chart
- It makes budgeting less intimidating
- It improves decision-making over time
For example, if your spending slice is too large, you immediately know where to adjust. According to the Consumer Financial Protection Bureau (CFPB), visual budgeting tools improve financial awareness and consistency.
You can explore more budgeting basics on platforms like ConsumerFinance, which provides trusted financial education resources.
Takeaway: A pie chart turns abstract financial planning into a simple and visual system you can follow daily.
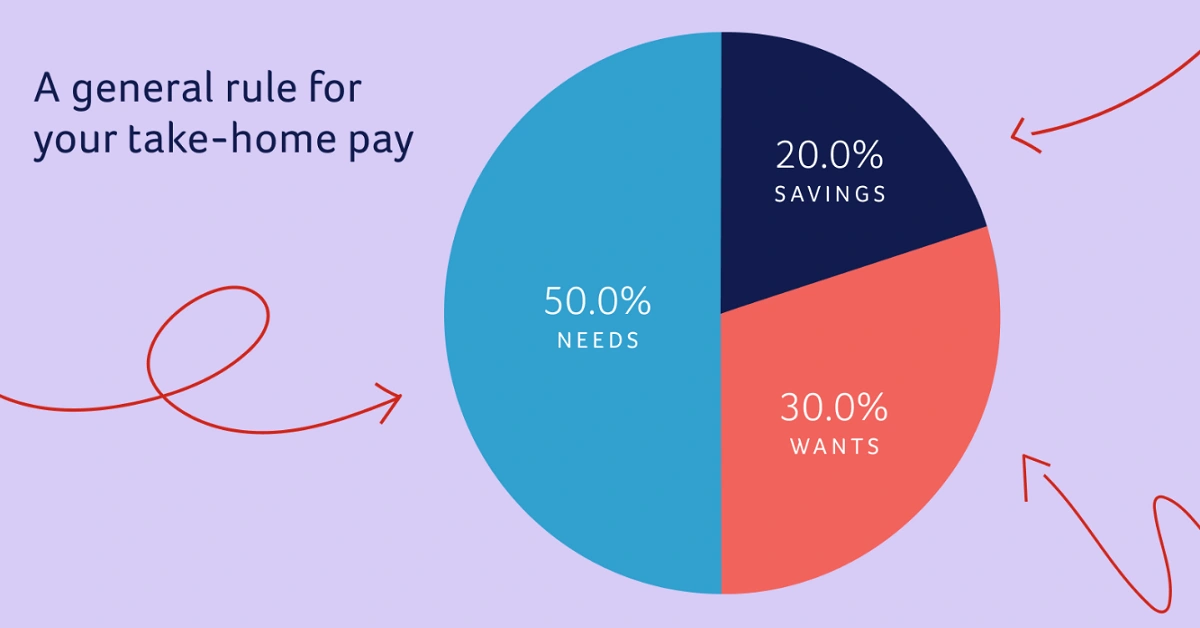
The Ideal Income Split: A Simple Rule to Start
One of the most popular frameworks is the 50/30/20 rule. It divides your income into three main categories:
1. Needs (50%)
This includes essential expenses:
- Rent or mortgage
- Utilities
- Groceries
- Transportation
- Insurance
2. Wants (30%)
These are lifestyle choices:
- Dining out
- Entertainment
- Subscriptions
- Travel
3. Savings and Investments (20%)
This portion builds your future:
- Emergency fund
- Retirement accounts
- Stocks or mutual funds
- Long-term goals
This rule is not rigid. You can adjust it based on your income level, debt, or financial goals.
Takeaway: The 50/30/20 rule is a reliable starting point, but flexibility is key to making it work for your situation.
How to Create Your Own Income Pie Chart
Building your own pie chart is simple and can be done in a few steps.
Step-by-Step Process
- Calculate your monthly income after taxes
- List all your expenses and financial goals
- Group them into categories (needs, wants, savings, investments)
- Assign percentages to each category
- Adjust until it reflects your priorities
Example Breakdown
If you earn $4,000 per month:
- Needs: $2,000 (50%)
- Wants: $1,200 (30%)
- Savings/Investments: $800 (20%)
You can use free tools like spreadsheets or budgeting apps to visualize this breakdown.
Takeaway: Creating a pie chart helps you turn numbers into a clear, actionable financial plan.
Adjusting Your Pie Chart Based on Life Stages
Your income allocation should evolve as your life changes.
Early Career
- Focus more on skill-building and basic savings
- Example split: 60% needs, 25% wants, 15% savings
Mid-Career
- Increase investments and retirement contributions
- Example split: 50% needs, 20% wants, 30% savings
Pre-Retirement
- Prioritize wealth preservation
- Example split: 40% needs, 20% wants, 40% savings
According to Vanguard’s retirement research, increasing savings rates over time significantly improves long-term financial security.
Takeaway: Your pie chart should grow with you and reflect your changing priorities.
Saving vs Investing: Understanding the Difference
Many people confuse saving with investing, but they serve different purposes.
Saving
- Low risk
- Easy access
- Ideal for short-term goals and emergencies
Investing
- Higher risk
- Long-term growth potential
- Includes stocks, bonds, and funds
A healthy financial plan includes both.
Key Definition
Emergency Fund: A cash reserve that covers 3–6 months of living expenses in case of unexpected situations.
Without savings, investing becomes risky because you may need to withdraw funds early.
Takeaway: Savings protect your present, while investments build your future.
Common Mistakes When Dividing Income
Even with a plan, mistakes can happen. Here are the most common ones:
- Ignoring savings completely
- Overspending on lifestyle upgrades
- Not adjusting the budget over time
- Failing to track expenses
- Relying only on rough estimates
Avoiding these pitfalls can significantly improve your financial health.
You can find practical budgeting strategies and insights on platforms like mygreenbucks.us, which focus on sustainable money management.
Takeaway: Awareness of common mistakes helps you stay disciplined and avoid financial setbacks.
Tools and Strategies to Stay Consistent
Consistency matters more than perfection. Use these tools to stay on track:
Budgeting Tools
- Spreadsheets
- Mobile apps
- Financial dashboards
Smart Habits
- Automate savings and investments
- Review your pie chart monthly
- Track every expense for at least 30 days
Behavioral Tip
Start small. Even a 5% savings rate is better than none. Gradually increase it over time.
Takeaway: The right tools and habits make your income division sustainable and stress-free.
FAQs
1. What is the best way to divide income?
The best way is to use a structured approach like the 50/30/20 rule and adjust it based on your goals and lifestyle.
Takeaway: A flexible framework works better than a rigid rule.
2. How much should I save each month?
Aim for at least 20% of your income, but start with what you can manage and increase gradually.
Takeaway: Consistency matters more than the exact percentage.
3. Should I invest before saving?
No. Build an emergency fund first, then start investing for long-term growth.
Takeaway: Savings create a safety net before you take investment risks.
4. Can a pie chart really help with budgeting?
Yes. A pie chart makes your financial allocation visual and easier to understand and adjust.
Takeaway: Visualization improves financial decision-making.
5. How often should I update my income allocation?
Review and adjust your budget at least once a month or after major life changes.
Takeaway: Regular updates keep your financial plan relevant.
Conclusion
Dividing your income into saving, spending, and investing is one of the most effective ways to build financial stability. A pie chart simplifies this process by giving you a clear visual breakdown of where your money goes. When you follow a structured approach, adjust it over time, and stay consistent, you gain control over your finances and move closer to your long-term goals.
Final Takeaway: A well-planned income pie chart transforms financial confusion into clarity, helping you balance present needs with future growth.